For whatever reason, there’s a lot of humor in programming. From bogus HTTP responses to fun jargon, we’re a funny bunch. In practice, the only thing funnier than an idea is an idea that actually runs, so I decided to see how awful Bad Code could really be.
The searching and sorting of arrays is a popular (and central) topic in computer science. There’s been a lot of time and effort spent ensuring we can sort array as efficiently as possible. Typically, efficiency in sorting methods is measured as a function of input length vs number of loops. A great sort won’t appreciably increase ruznning time as the input gets longer. A bad sort, on the other hand…
When the topic of bad searches come up (at parties or whatever, as it does), a crowd favorite is always the infamous bogosort. The idea is simple: take an array, randomize it, and check if it’s sorted. If not, repeat! In the best case, you got really lucky and this sort is very fast. Most of the time, you’re less lucky and this is actively awful. Let’s see how this would shake out in practice.
The following is a simple implementation of bogosort using Ruby’s #shuffle! method (plus some extra code to track how many shuffles it took before the array was sorted). It also adds the sorted? method to arrays, to help us know when we’ve (eventually) sorted the array.
class Array  def sorted?    1.upto(size - 1) do |i|      # if i > i-1, we good      return false if self[i] < self[i - 1]    end    true  endend
# Performs the bogosort, lets us know how many tries it tookdef num_shuffles(arr)  c = 0  # the sort itself  until arr.sorted?    arr.shuffle!    c += 1  end  cend
Since the randomness of the sort begets such a high variance in results, we’ll want to do a fair number of trails and take the average.
def bogosort_counter(n)  arr = 1.upto(n).to_a  res = []
  5000.times do    # start in a random order    res << num_shuffles(arr.shuffle)  end
  puts "It took an average of #{res.average.round(2)} shuffles to sort an array of length #{n}"end
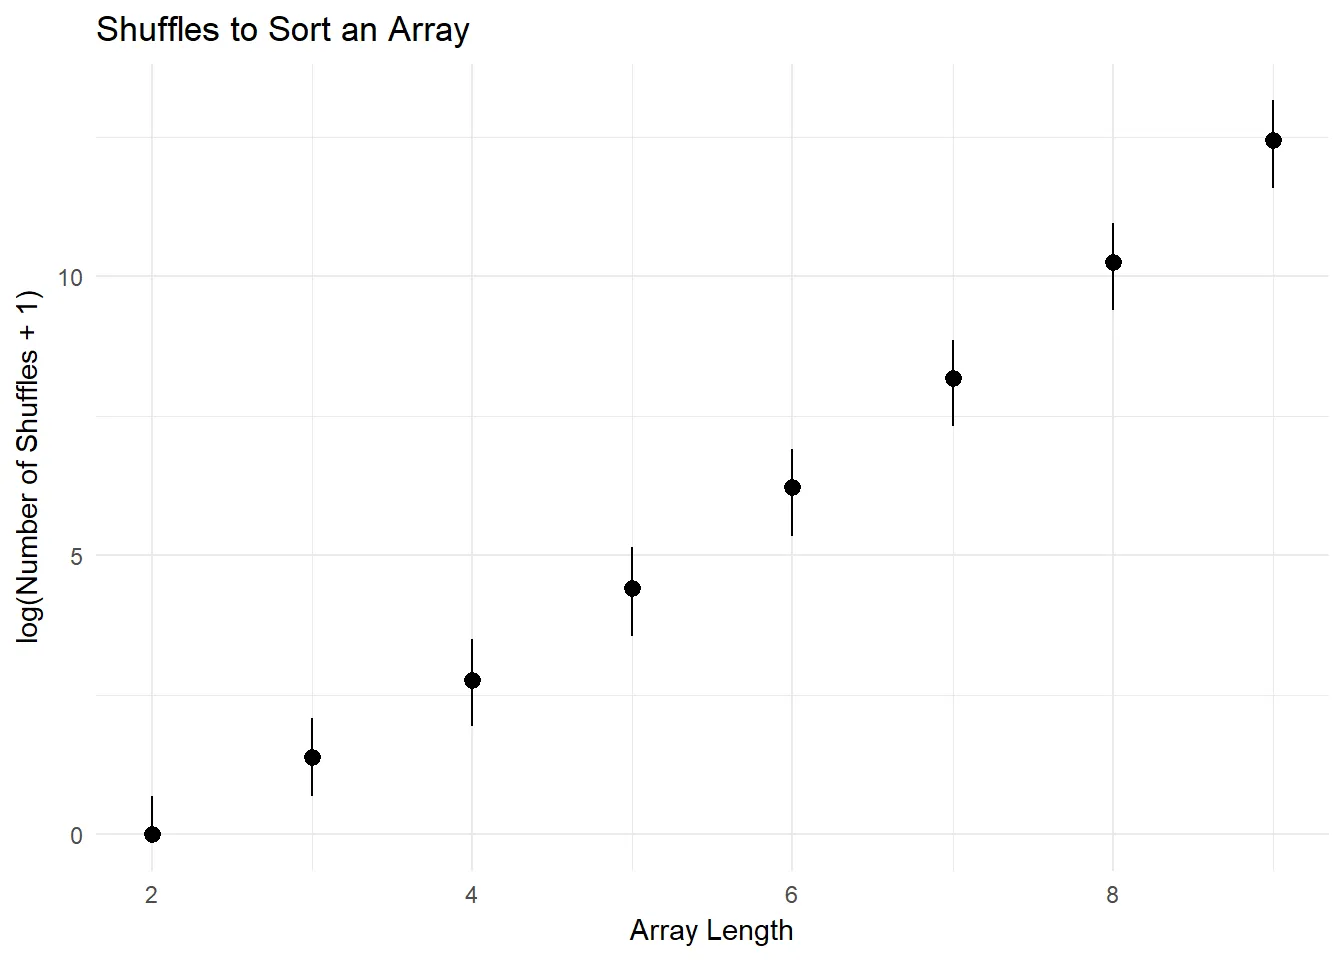
With our measurement tools in hand, I ran the trials with increasingly long arrays. It’s tough to graph numbers that have such a large range (2 element array sorted fairly quickly, large ones… did not), so we used a logarithmic scale. The lines on either side of the dots show the middle 50% of the number of shuffles. As you can see, the number of shuffles scales pretty aggressively with the length of the input.

| Array Length | Average Number of Shuffles (5k Trials) |
|---|---|
| 2 | 0.97 |
| 3 | 5.07 |
| 4 | 22.8282 |
| 5 | 121.59 |
| 6 | 715.84 |
| 7 | 5019.65 |
| 8 | 40985.28 |
| 9 | 369657.95 |
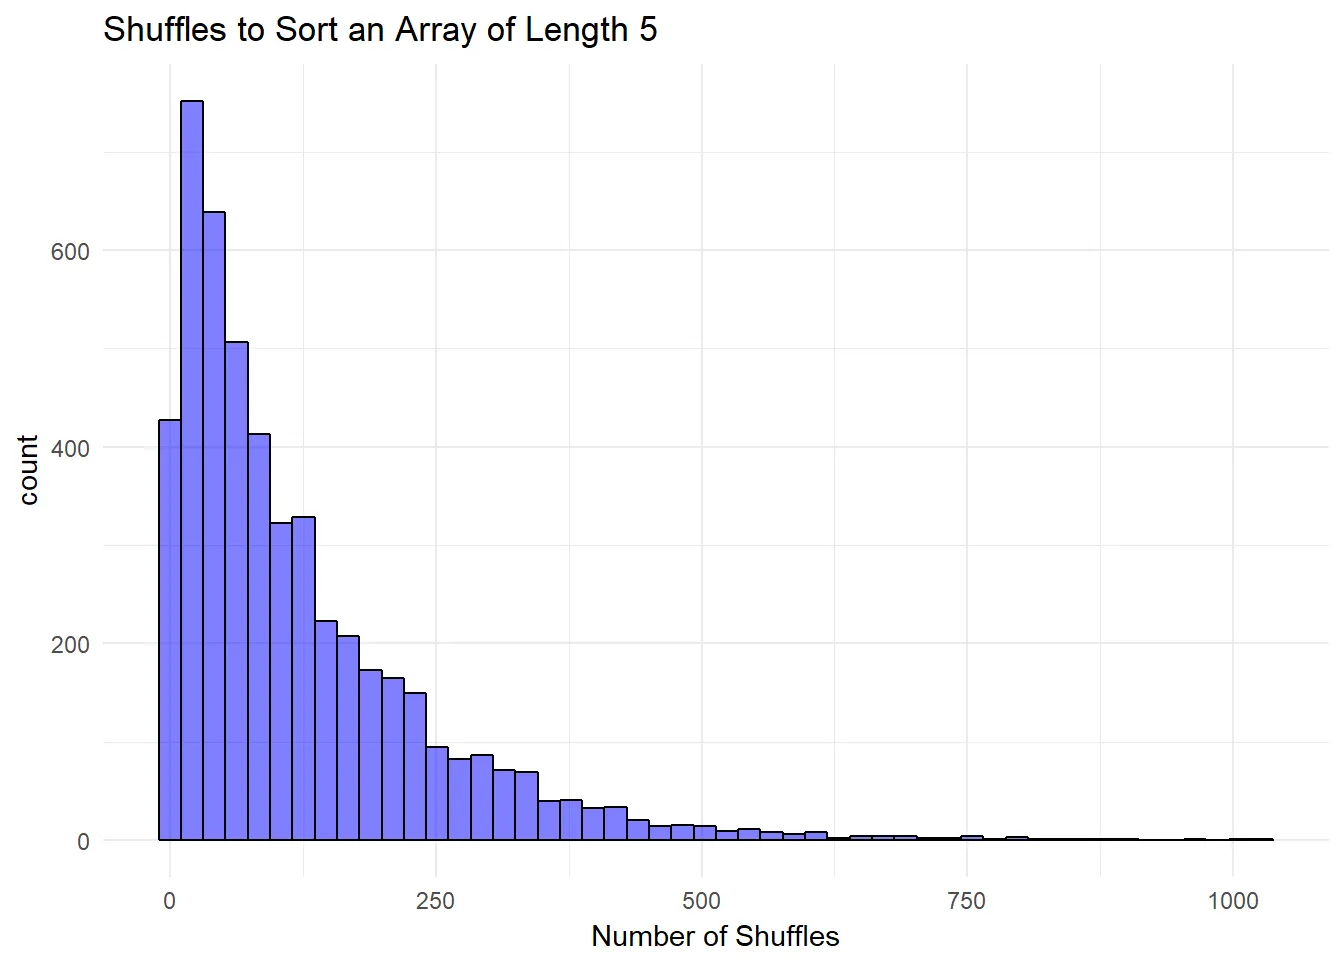
Each array length follows a remarkably similar pattern, known as a negative binomial distribution (I am told), meaning the number of shuffles is quite variable. For array length 5, it takes 10^5 shuffles. but it’s just as likely for it to take many more tries. This causes the (incredibly) long tail you see out to the right.

If you think those numbers are big, it’s because they are. Big numbers don’t mean anything without context though. To help provide that context, I modified the script to measure the actual clock-on-the-wall time you would spend sorting an array length n. Note that the table skips the first few values of n, as they were sorted too fast for Ruby to capture (which is a good thing, I guess).
| Array Length | Average time to be sorted (5 trials, seconds) |
|---|---|
| 8 | 0.02 |
| 9 | 0.25 |
| 10 | 1.19 |
| 11 | 10.28 |
| 12 | 304.68 |
| 13 | 2029.58 |
| 14 | Ran computer all night, didn’t complete 5 trials |
These results are… not inspiring. Each element added to the array adds roughly a factor of 10 to how long the script takes to run.1 And again, the precious seconds you spend sorting doesn’t actually guarantee your array will end up sorted anyway. Unless you’re feeling incredibly lucky, I’d stick to something faster and more reliable. Maybe a nice bubble sort.
Huge thanks to Evan Batzer for his time and expertise with chart creation. You can find out more about him and his work here.
Footnotes
-
These results were gathered using Ruby
2.4.1running on ani7-7820HQ CPU @ 2.90GHz↩